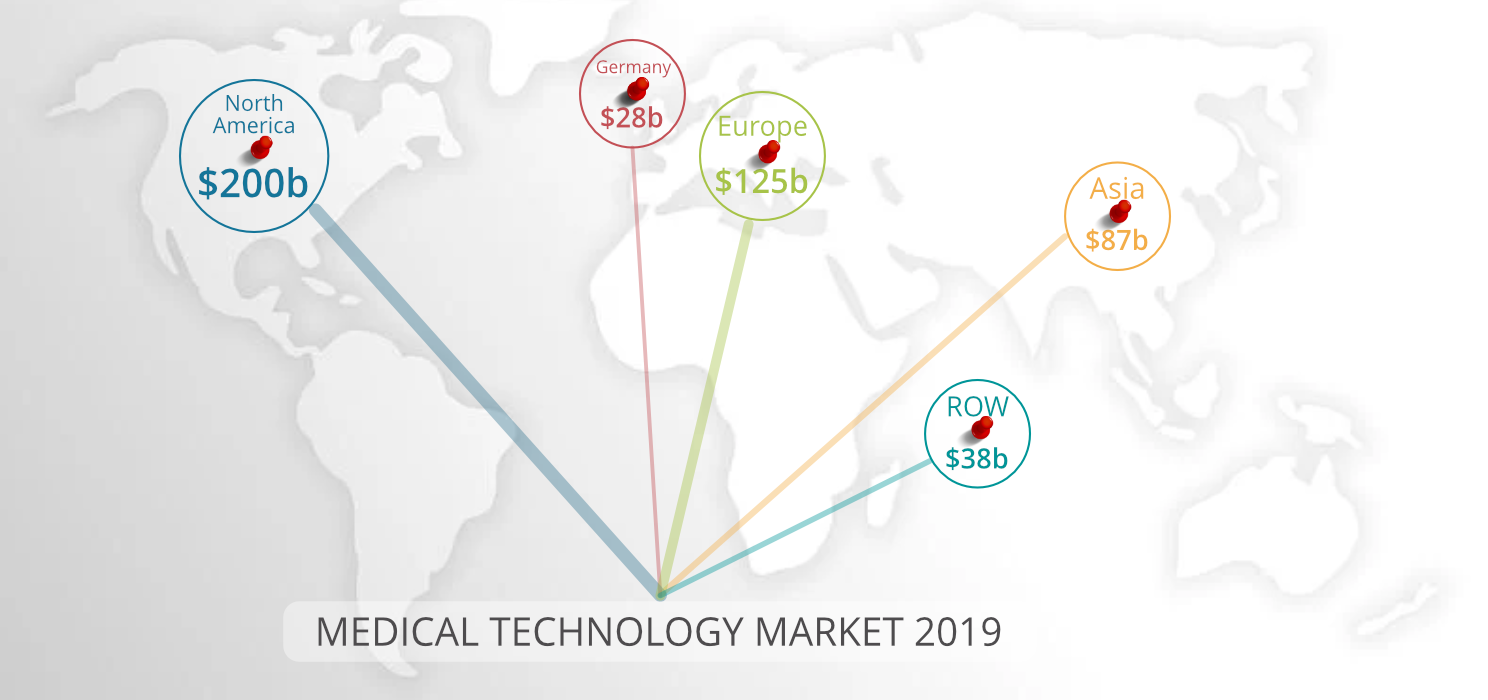
In 2019, global medical technology sales were $ 450 billion growing by 5.2% p.a.*¹
Despite the modest, general growth, there are always business areas that are growing at 45% p.a. One example is trans-catheter heart valves with a growth rate of 42% p.a. (Edwards LifeSciences, 2011-2016), another is infrared fluorescence imaging to display tissue perfusion with 49% p.a. (Novadaq, 2011-2016).
There is also a healthy basis for continued growth: The aging of the population, e.g. in the U.S 3.1% more citizens over 65 years of age per year. In addition, there are the Megatrends that are driving case numbers.
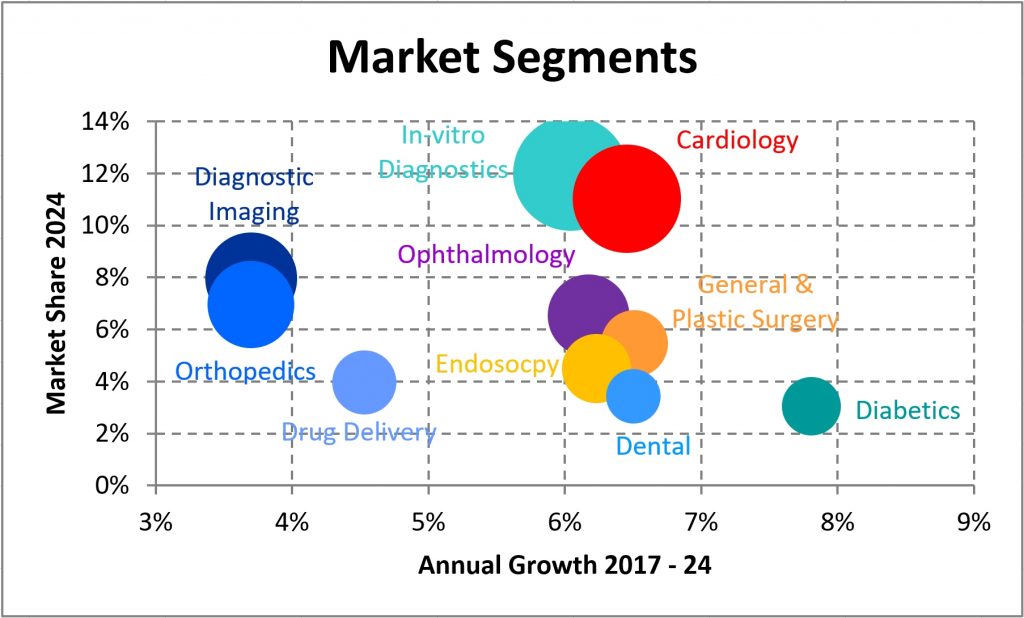
Market Segments*²
In-vitro diagnostics is the largest sector, followed by cardiology and diagnostic imaging. The graph implies a market growth of 5.6% p.a.
The economic burden of heart disease amounts to around 300 billion Dollars in the U.S.A. and 300 billion Euros in the EU. In the U.S., 60% of this is direct costs compared to 50% in Europe.
Growth Drivers: Megatrends
- Aging societies (U.S.: 3.1% more retirees 65y+ per year)
- Change in the spectrum of diseases
- Higher incidences
- More chronic diseases (Diabetes, Obesity, Coronary Heart Disease, COPD, Dementia)
- Limitation of the health budget (17.7% of the U.S. gross domestic product, 11.9% in Germany)
- Correlation of social status and life expectancy (in London 2015: 10 years)
- Mobility
- Independent living
Players*³
There’s a lot of money involved, as the market capitalization of the big players shows:
| Ethicon / J&J | $422b | Fesenius Medical Care | $24.4b |
| Boston Scientific | $51.5b | Siemens Healthineers. | $96.7b |
| Abbott Laboratories | $199b | Cardinal Health. | $16.2b |
| Philips Healthcare | $49.7b | Stryker | $90.9b |
| Medtronic Plc | $157b | DePuy Synthes | n/a |
| Baxter International Inc. | $40.9b | Becton Dickinson | $76.3b |
| GE Healthcare | $99.2b | $b = $Mrd. |
and substantial profits
| Companies | Sales | Cross margin | EBIT | EBITDA |
|---|---|---|---|---|
| Johnson & Johnson | $82.1b | 66.4% | 21.5% | 30.4% |
| Medtronic | $28.9b | 67.4% | 17.8% | 28.5% |
| Stryker | $14.9b | 65.1% | 19.5% | 26.0% |
| Boston Scientific | $10.7b | 71.0% | 10.8% | 25.9% |
In the U.S.A., the EBIT of public MedTech companies is around 20%, in Germany that of electro-medical companies 16% and that of industry 8.1% *⁴
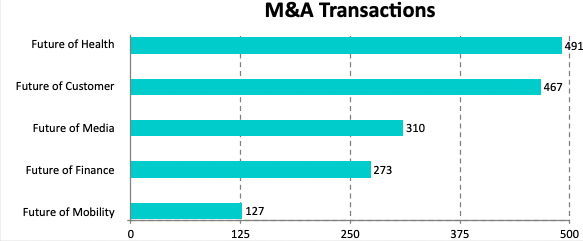
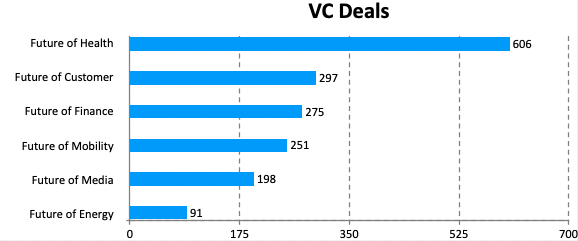
Global Transaktions*5
With a total of 7,377 transactions in 2017/18, healthcare is at the top with 491 takeovers and 606 VC investments.
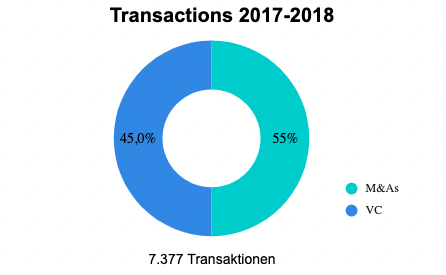
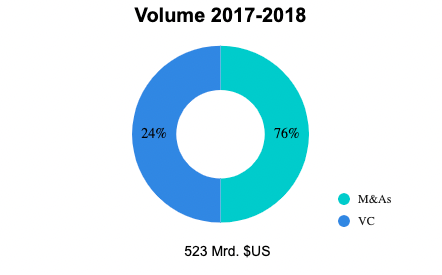
56% of the value of global M&A transactions is in the U.S., while it is 13% in the EU
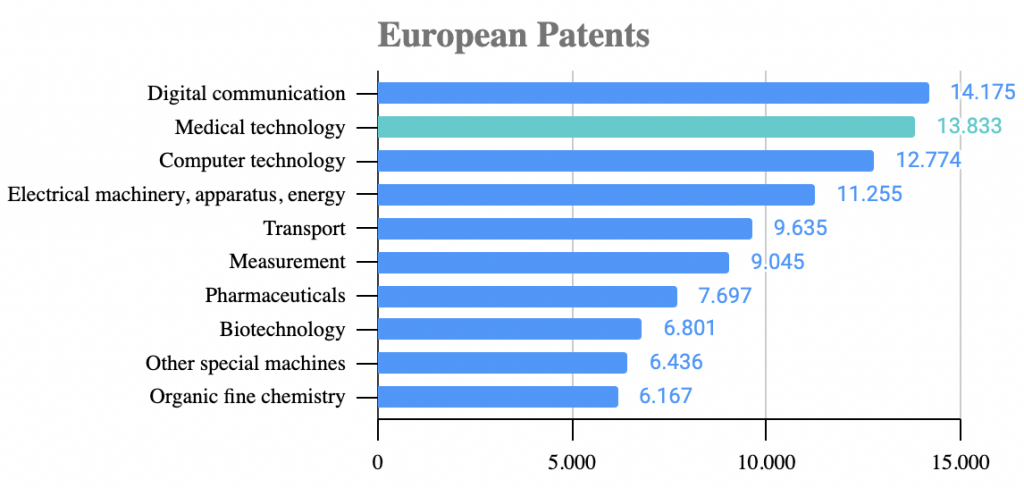
European MedTech Patents*⁶
MedTech is an extremely agile market, not just when it comes to acquisitions. In terms of patent approval, MedTech and Digital lead the way – in the previous year, the positions were reversed.
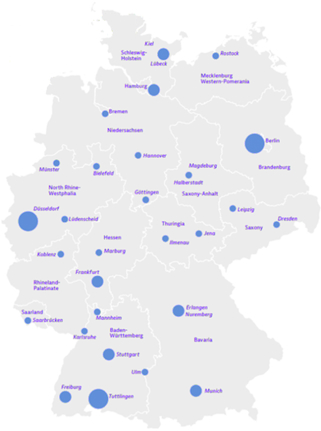
German MedTech*⁷
- 212,000 jobs
- 500.000 products
- Revenue: 30.3 Mrd€
- Export rate: 65%
- With 10%, Germany has the second largest global market share after the U.S.
- German expenditures for MedTech: 36 Mrd€
- Corporations and firms:
- 90 MedTech firms with more than 250 employees
- 13.000 small enterprises with 60.000 employees
To summarize: with its outstanding growth opportunities and enormous profitability, there are still treasures to be found in the medical technology market!
References:
- Precedence Research «Medical Devices Market — Global Market Size, Trends Analysis, Segment Forecasts, Regional Outlook 2020 — 2027»
- Evaluate MedTech, «World Preview 2018, Outlook to 2024»
- Yahoo Finance 18.01.2021 / 21
- Hans Böckler Stiftung, «Branchenanalyse Medizintechnik», Mai 2020
- Deloitte 2019 «Small Gains, Big Wins»
- «European MedTech Industry in Figures 2020»*6:
- «BVMed Branchenbericht 2020»